In image processing, the initial data are images – functions of two coordinates. Normally, images are represented in discrete form as two-dimensional arrays of image elements, or “pixels” – i.e. sets of non-negative values , ordered by two indexes – 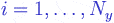 (rows) and
  (columns).
A major class of methods used in image processing are various filters. The goal of filtering is to improve the initial image, e.g. to reduce the noise, to increase the contrast, to highlight boundaries, etc. Other statistical approaches, like parameter estimation and hypothesis testing can also be applied to images.
Besides the gray-scale images, where the elements are scalar values, there are methods for processing color images, where each pixel is represented by several values, e.g. by its “red”, “green”, “blue” values determining the color of the pixel.