A probability density function or curve is a non-negative function (  ) that describes the distribution of a continuous random variable. If is known, then the probability
  that a value of the variable is within an interval is described by the following integral
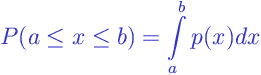
For very small intervals  , where is a small value, the relation is simpler:

The reason for using probability density instead of probability itself is the following: Continuous variables, in contrast to discrete random variables cannot be described by the probability of particular values of because there are infinitely many possible values and they are not countable. This makes the probability of any particular value equal to zero. For example, the probability that the body weight of an individual is exactly  kilogram is practically zero, but the probability that body weight is within the interval
  kg is a measurable quantity.
Note that the probability density function is the curve itself, and the probability is the area under the curve.