The chi-square statistic (or -statistic) measures agreement between the observed and hypothetical frequencies. This statistic is computed from two entities: hypothetical probabilities  of the values of a discrete random variable, and the observed frequencies
  of these values – the numbers of observations of each type. The chi-square statistic is the heart of the chi-square test.
The chi-square statistic is computed according to the following formula:
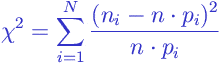
where
 is the number of observed events of the th type;
 is the hypothetical probability of the event of the th type.
Sampling distribution of this statistic approaches the chi-square distribution with  degrees of freedom when the number of observations grows infinitely. This explains the name of the statistic.
For small samples, the sampling distribution of this statistic is not guaranteed to be the chi-square distribution. In such situations resampling is often used (see more on resampling in the online book Resampling: The New Statistics).
There are other statistics that obey the chi-square distribution and, therefore, might be called “chi-square statistics” too. But the statistic described here is the most famous one – it is discussed even in introductory texts in statistics and widely used in practice.