The likelihood ratio test is aimed at testing a simple null hypothesis against a simple alternative hypothesis. (See Hypothesis for an explanation of “simple hypothesis”).
The likelihood ratio test is based on the likelihood ratio r as the test statistic:
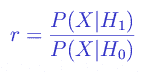
where X is the observed data (sample),  is the conditional probability of X provided the hypothesis H is true, H0 is the null hypothesis, H1 is the alternative hypothesis. See also Likelihood function.
According to the Neyman-Pearson lemma, the likelihood ratio test is the most powerful test for any significance level (probability of Type I error). See also Power of a Hypothesis Test.