Any continuous function defined on a finite interval  of length can be represented as a weighted sum of cosine functions with periods
  :
:

where
 is the frequency of the i-th Fourier component;
 is the amplitude of the i-th component;
 is the phase of the i-th component.
The function describing the dependence of the amplitude on the frequency in the above expression is called the amplitude spectrum of the function .
The function describing the dependence of the phase  on the frequency is called the phase spectrum of the function .
Thus, the Fourier spectrum of a function is represented by two functions of the frequency – the amplitude spectrum and the phase spectrum . These two are often combined into a single complex-valued function  :
:
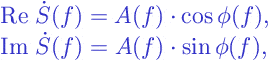
where
 is the real part of a complex number;
 is the imaginable part of a complex number;
The concept of the spectrum plays an important role in signal processing, time series analysis, spectral analysis.