A random variable x has a Bernoulli distribution with parameter 0 < p < 1 if
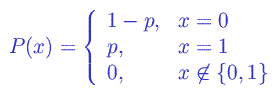
where P(A) is the probability of outcome A. The parameter p is often called the “probability of success”. For example, a single toss of a coin has a Bernoulli distribution with p=0.5 (where 0 = “head” and 1 = “tail”).
The Bernoulli distribution plays a fundamental role in probability theory and statistics. It is a good model for any random experiment with two possible outcomes, for example, yes/no answer (of a respondent in an opinion poll), died/survived (in a drug trial) etc.